THE MASTERCLASS
In a world with abundance of data, how can designers become familiar with different facets of data, blend in data with their design process, and transform data into insights that drive outcomes for their users?
Through this course, you’ll be able to collaborate with other roles more seamlessly, articulate design decisions based on data & metrics, and learn methods & frameworks to better communicate data.
This course covers three key lenses to look at data for designers-in-tech. First, becoming data literate by understanding of the many forms & limitations of data all around us. Second, translating user behavior (past, present, future) into qualitative & quantitative data that can inform your design process. Third, communicating data in more effective ways, beyond stock graphs & pretty pictures.
By the end of this course, designers should be able to:
- Understand how data is collected, calculated & interpreted
- Articulate design decisions by leveraging data & intuition
- Create compelling visualizations to narrate insights
First cohort starts November 16
Sign up for an inviteAbout Rasagy
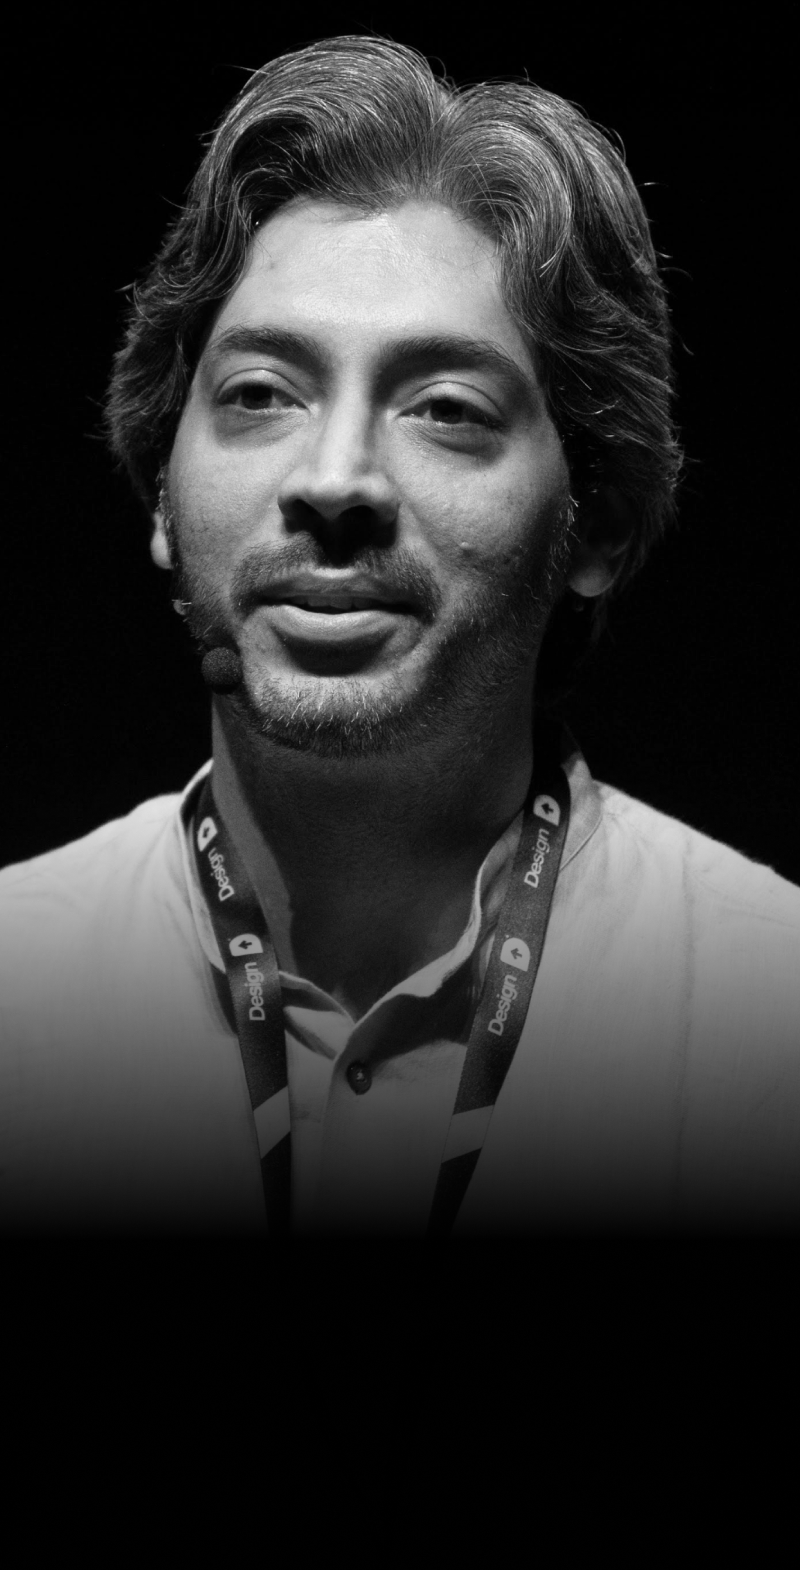
Rasagy is an Information Designer, Data Artist, and Sketchnoter. He’s currently building the future of product analytics at Sundial.
He has spent the last decade designing data-heavy products at Microsoft, Mapbox, Barclays, and Gramener. In his free time, he teaches data visualization & cartography at NID, IDC IIT Bombay, IIM-A, ISB & through corporate workshops. He’s an alumnus of NID Bangalore & BITS Pilani, Goa Campus and loves staying connected with design community by organizing events & meetups.

